.png)

Your Shopify data is clean. You connected it in an afternoon, the schema made sense, and you were running cohort analysis by the end of the week. Amazon took longer but it got there. TikTok Shop, same story.
Then you land Target. And Whole Foods. And Sprouts. And behind them a long tail of twenty specialty accounts that each want something slightly different. Suddenly you are exporting CSVs from a portal that looks like it was built in 2006, because it was.
Retail data is roughly twenty years behind ecommerce, and most brands do not price that in when they decide to go into retail. They budget for the buyer meetings, the slotting fees, the trade spend, and the inventory. They do not budget for the fact that six months from now, nobody at the company will be able to answer “how did we do at Target last week” without three days of notice.
Retail data consolidation is the work of pulling sales, inventory, and shipment data out of every retailer you sell through, normalizing it into one consistent schema, and making it queryable fast enough to act on. Most brands treat that as one project. It is three, and most tools only solve one of them.
The three problems, in order
- Access. Getting the data out of each retailer at all.
- Consolidation and normalization. Getting the data to agree with itself once you have it.
- Insight. Getting an answer out of it fast enough to act on.
Solve one and two without three and you own a very expensive data warehouse. Solve three without one and two and you get a confident answer built on the wrong numbers. Most brands have never solved all three at once, which is why retail reporting has stayed a headcount problem for two decades.
Problem one: you literally cannot get the data
Every retailer makes data available in its own way. Some have a vendor portal. Some have a paid data program. Some have nothing at all, and you are negotiating.
Sprouts is the example worth remembering. There is no portal to log into. What you can get is a distributor login through KeHE, which gets you close enough to estimate sell-in shipments. That is not written down in any documentation. It is the kind of thing you know because you have done it before, and it is the difference between having Sprouts data and shrugging when your CEO asks about Sprouts.
Now multiply that by the long tail. Most brands have one or two accounts that matter most and then twenty or thirty more, each its own small project with its own access path, credentials, refresh cadence, and person to email when it breaks.
Earth Breeze is a useful case here, because they had already reached real scale before they solved it: DTC on Shopify, Amazon, Walmart, and brick-and-mortar retailers around the world. Their problem was never a shortage of data. It was that the data sat in a dozen places, which meant they could not answer something as fundamental as what a customer in each segment was actually worth. Jordan Benjamin, their EVP of Finance, now describes it as having an FP&A super team at his fingertips. That is what it feels like when access stops being the constraint.
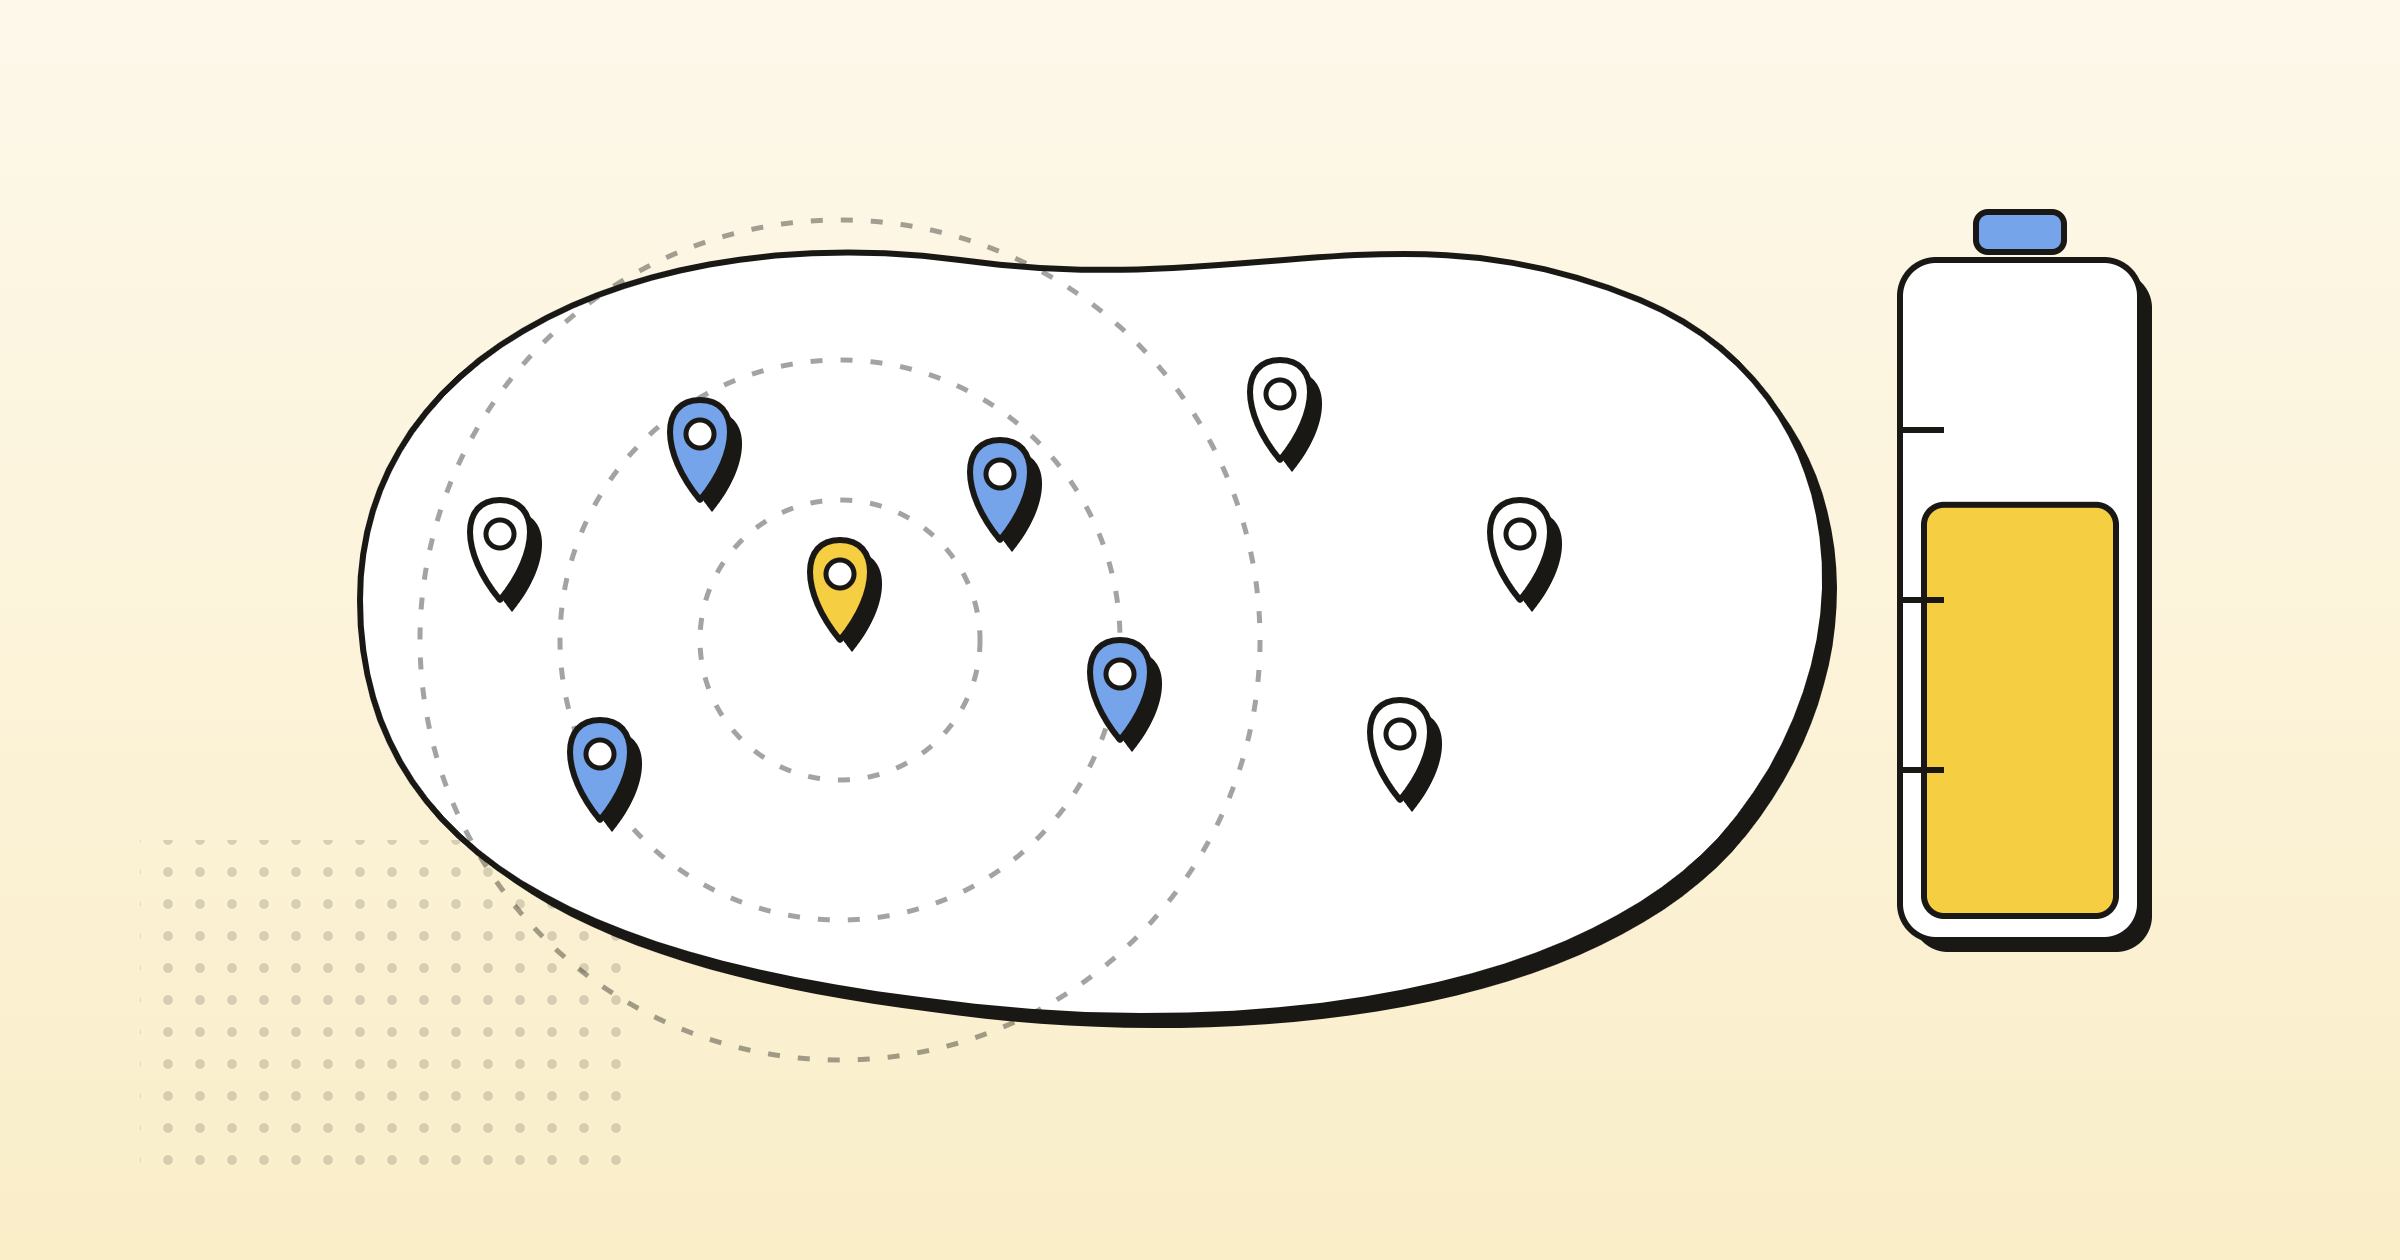
Drivepoint connects to more than 400 retail data sources through our data partnerships, from mass retail to grocery to long-tail specialty. The connections matter. So does the less glamorous half, which is knowing which retailers hand you sell-in, which hand you sell-through, and which require a workaround.
Problem two: the data does not agree with itself
Congratulations, you have fifteen portals worth of exports. Now reconcile them.
How Walmart reports gross sales is not how Target reports gross sales is not how Kohl’s reports gross sales. The label is identical. The definition underneath it is not.
SKU identifiers are worse. At PetSmart, the identifier you need lives in the description field, not in a field called SKU. Multiply that across your accounts and you land in the specific hell where you can produce net sales across every retailer and still cannot say which product sold, because the product keys do not line up.
Then there is time. Retailers report at different grains on different schedules. Weekly here, monthly there, a Monday morning drop somewhere else. Building one view means aligning all of it, every week, forever.
The traditional solution was headcount. One financial analyst per account, each hand-standardizing their retailer’s export into an internal format and passing the clean file downstream to finance or sales or ops. That works, in roughly the way a bucket brigade works.
The clearest picture of what it costs comes from Ibex, and the reason it lands is that the quote is not from a finance person. Andrew Bridgers is their Director of Supply Chain and Planning, and his point is that without the right tooling he would have spent almost half his week building financial models. Two days a week of the person whose actual job is planning supply, spent assembling inputs instead. Ibex avoided $314,000 in annual finance personnel costs and recovered more than 190 hours a year.
That is the tell. When normalization is manual, it does not just consume analysts. It consumes whoever sits closest to the decision.
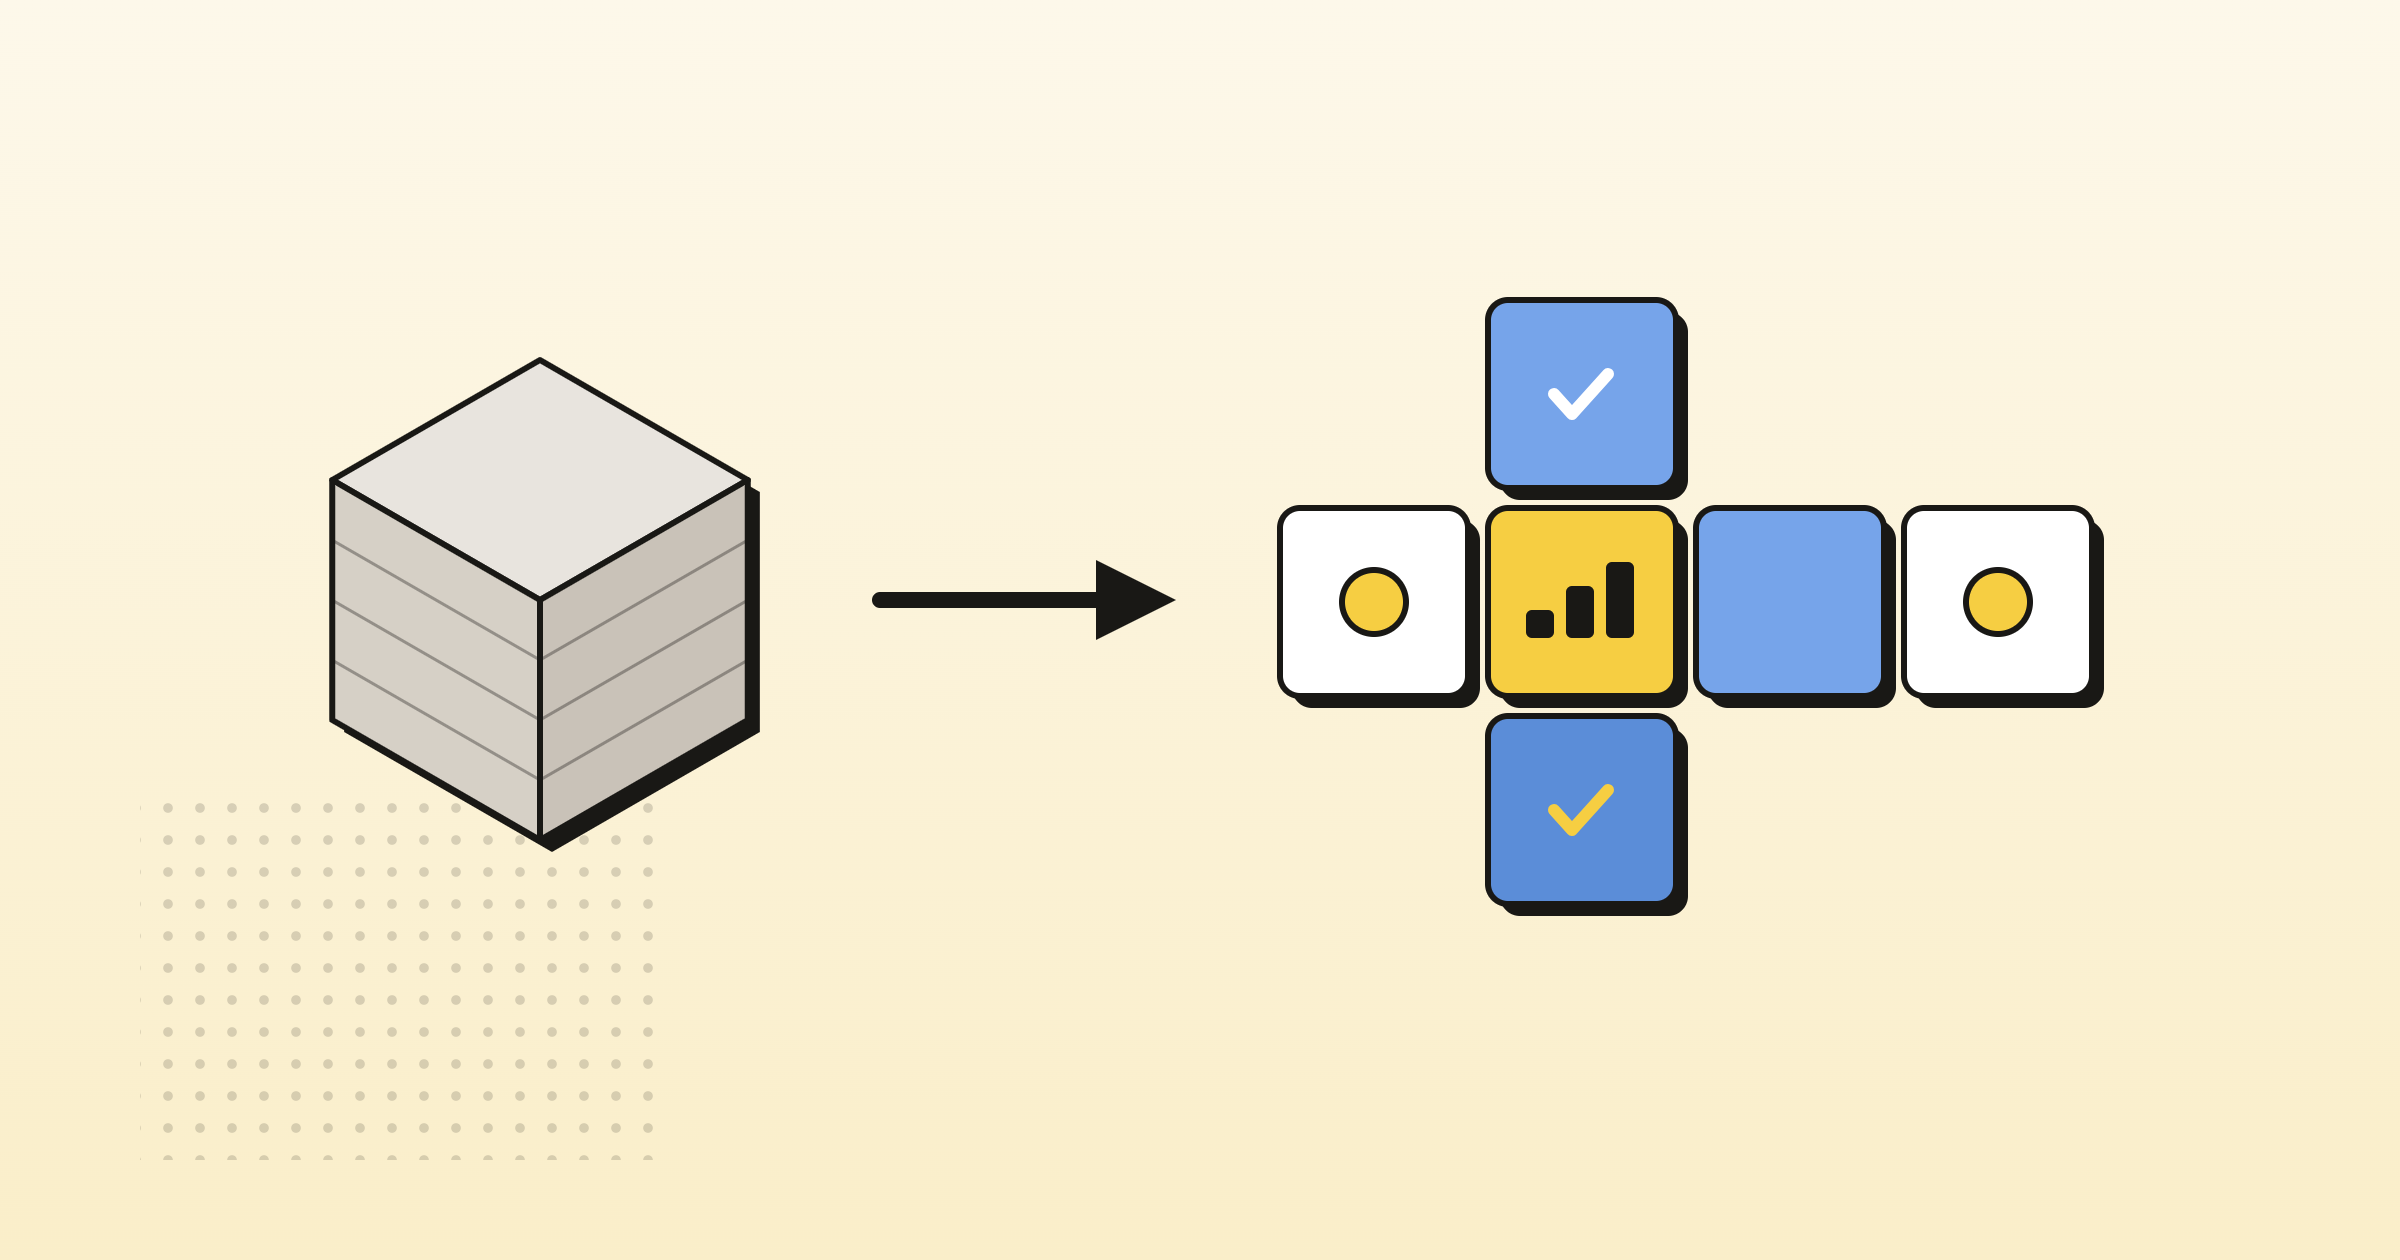
Drivepoint handles this in the data modeling layer. Not a dump of every retailer into one wide table, which is what “consolidation” usually turns out to mean. Actual normalization: schemas untangled, metrics reconciled to a single definition, product keys mapped across retailers.
Problem three: even clean data has been hard to use
Say you get through one and two. You have a normalized retail layer. You build a report on top of it.
Then you add a retailer. A column changes. The report breaks.
So retail reporting became whatever your analyst could build and maintain in Tableau or Excel, refreshed on their schedule, fragile to every change in the business. The reports that survive are the ones nobody touches, which means they answer last year’s questions.
SEEQ is the sharpest published example of what the lag costs. Before Drivepoint they forecast quarterly, sometimes annually, working from data that ran 30 to 60 days behind, with nationwide Target distribution alongside DTC, Amazon, and TikTok Shop. Their story names the consequence outright: stockouts and marketing overspend. That is a brand making inventory and spend decisions against numbers up to two months old, and paying for it in both directions at the same time.
They run on live data now, and forecasting went from a two to three day exercise to instant. Keenan Kelly, their CEO, puts it simply: he does not have to wait for anybody.
Most brands are not as far behind as quarterly. But every one of them is somewhere on that spectrum. The retailer file that lands Monday morning sets the KPIs for the week, and if the person who pulls it is on vacation, the week runs on last week’s assumptions. That is a single point of failure sitting directly underneath your forecast.
What changes when the retail layer is agent-ready
Here is what is new. All 400+ retail sources are now available through the Drivepoint MCP server as agent-ready retail tables. The normalized layer is not a foundation that a report gets built on once a quarter. It is something anyone on your team can ask a question of, in plain language, and get a real answer back.
That matters because four teams need four different things from the same data:
- Sales and the exec team need to know what is selling, where, and whether they are going to hit their number.
- Finance needs to book revenue correctly and push it to the general ledger.
- Ops and demand planning need to know what to produce next.
- Inventory needs the stockout risk and the reorder decision.
These four have historically never worked from the same numbers, because the normalization step was a bottleneck owned by one person with a queue.
Two short demos, same underlying retail layer, two very different jobs.
The sales and executive view. How a retailer launch is actually performing, without a three-day data pull in front of it.
The operations view. Same data layer, pointed at what to produce, what to ship, and what is at risk.
California Naturals is the published proof that the consolidation actually happens. Four leaders now work from one live model, wholesale profitability analysis included, with a monthly 90-minute review in place of a reporting scramble. Their monthly reporting time dropped from three hours to 90 minutes. Kimberly Andrews, their VP of Finance, describes the change as no longer spending her time pulling actuals. The platform does that part. She does the thinking.
Taste Salud is the same story mid-expansion: 10x sales growth while moving into Walmart and Target, 330+ hours a year recovered on budgeting alone, roughly $200,000 in annual savings.
That shift shows up first on the sales side: seeing sell-in, sell-through, and trade spend in one place, per account, instead of waiting on a retail portal export.
The reframe
Retail data has been a headcount problem for twenty years. You wanted better retail reporting, so you hired another analyst, and you accepted that the answer would land a week late.
It is an infrastructure problem now. That is a better problem to have, because infrastructure compounds and headcount does not.
The brands pulling ahead in retail this year are not the ones with the biggest analyst bench. They are the ones who stopped treating retail data as something to be assembled and started treating it as something to be asked.
Retail data questions, answered
What is the difference between sell-in and sell-through?
Sell-in is what the retailer buys from you, meaning the purchase order from Target or Whole Foods. Sell-through, sometimes called sell-out, is what the shopper buys at the register. Finance tends to work from sell-in because that is what gets booked as revenue, and sales tends to work from sell-through because that is what proves demand. Watching the ratio between them is what tells you whether a reorder is coming or whether inventory is piling up at the retailer.
How do brands get sales data from retailers like Target, Walmart, and Whole Foods?
It varies by retailer, and that is the core problem. Some run a vendor portal you log into. Some sell access through a paid data program. Some, like Sprouts, have no portal at all, and the practical route is a distributor login that lets you estimate sell-in shipments. Most brands end up managing a different access path, credential set, and refresh cadence for every account they sell through. Drivepoint reaches more than 400 retail sources through data partnerships so brands do not maintain those paths individually.
Why is retail data harder to work with than ecommerce data?
Ecommerce platforms give you one schema, one refresh cadence, and clean product identifiers. Retail gives you a different schema per retailer. Gross sales is defined differently at Walmart than at Target. SKU identifiers sometimes live in a description field rather than a SKU field. Reporting grains and refresh schedules differ by account. So the work is not just collecting the data, it is reconciling definitions and mapping product keys before any of it can be compared.
What does it cost to handle retail data manually?
The traditional model is one retail financial analyst per major account, each standardizing exports by hand. The cost usually shows up somewhere less obvious. Ibex avoided $314,000 in annual finance personnel costs and recovered more than 190 hours a year, and their Director of Supply Chain and Planning noted he would otherwise have spent almost half his week building financial models. When normalization is manual, it consumes whoever sits closest to the decision, not just the analyst bench.
Can AI analyze retail sales data across multiple retailers?
Only if the data underneath it is already normalized. A model pointed at raw retailer exports will confidently compare metrics that are not actually comparable. What makes it work is a modeled retail layer where definitions are reconciled and product keys are mapped, exposed to the agent as structured tables. That is what the Drivepoint MCP server does, which is why sales, finance, ops, and demand planning can all query the same retail data in plain language and get answers that tie out.