// DRIVEPOINT FOR SALES

Sell-in, sell-through, and deductions. One view per account.

Drivepoint pulls scan and velocity data, shipments, and your GL into a live model so you can see the customer P&L for each retailer, what your trade promotions actually returned, and how many cases to put in the bottoms-up forecast next quarter.

Retail sales, reconciled.

01 · Data

Retail data that reconciles to what you actually got paid.

POS and velocity data tell you what sold. Your GL tells you what you collected after deductions, chargebacks, and trade spend. Drivepoint joins them so you can see real account profitability.

  • Scan, velocity, and sell-through by account and SKU from retailer portals and SPINS or Circana
  • Shipments, PO quantities, and sell-in from your WMS, IMS, or distributor (UNFI, KeHE)
  • Deductions, chargebacks, and trade promotion accruals vs. actuals from QuickBooks or NetSuite
Retail data that reconciles to what you actually got paid.
02 · Reporting & Alerts

Know how a promo did before the next one starts.

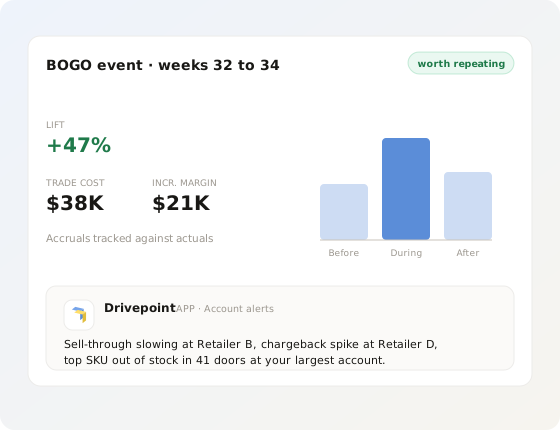
Weekly account reports, promo lift and ROI, deduction rates by retailer, and alerts when sell-through slows or a chargeback spikes. No more waiting on finance to run the numbers.

  • Trade promotion effectiveness: lift, incremental margin, and payback per event, with accruals tracked against actuals
  • Customer P&L and contribution profit by retailer, after deductions and chargebacks
  • Weekly velocity and inventory-at-retail reports, plus alerts when a top SKU goes out of stock at a top account
Know how a promo did before the next one starts.
03 · Forecasting & Planning

Account plans built on data, not gut.

How many cases of each SKU will you sell to each account next quarter? Build account forecasts from real velocity, distribution, and promo calendars, and see the cash and inventory impact finance needs to sign off on the PO.

  • Bottoms-up forecast by SKU by account, tied to the company model so finance and sales stop reconciling two versions
  • Scenario planning for 100 more doors, a new item, or a shifted promo calendar, with the fill-in timing ahead of the promo
  • Targets grounded in velocity and replenishment, not last year plus 10%
Account plans built on data, not gut.
// OUTCOMES

What changes when every account has one view.

01

Real margin on every account.

Customer P&L after trade, deductions, and chargebacks.

02

Prove which promos deserve a repeat.

Lift, incremental margin, and payback per event.

03

Forecast cases with confidence.

Bottoms-up by SKU by account, and a faster yes on the PO.

04

Spend your time selling.

Retire the twenty-hour-a-week download-and-paste spreadsheet.

// PROOF

Accurate forecasts built in minutes instead of manual entry powered immi's rapid wholesale expansion: 20 hours saved every month, $150K saved versus the alternatives, and monthly variance to budget cut in half.

Read the immi story →

// THE PLATFORM

Built for finance. Useful for everyone.

Drivepoint started as the AI finance platform for consumer brands. That is why the numbers on this page tie out to the P&L, and why your CFO will trust them. One source of truth, your view of it, with permissions so each team sees what it should.

See what Drivepoint
looks like for your brand.

Book a demo and see how quickly Drivepoint gets your complete financial model up and running — connected to your data, built for your channels, ready for your next big decision. Whether you're planning a retail launch, preparing for a raise, or replacing a spreadsheet that only one person can touch.

Book a demo