01
The Gap Does Not Disappear
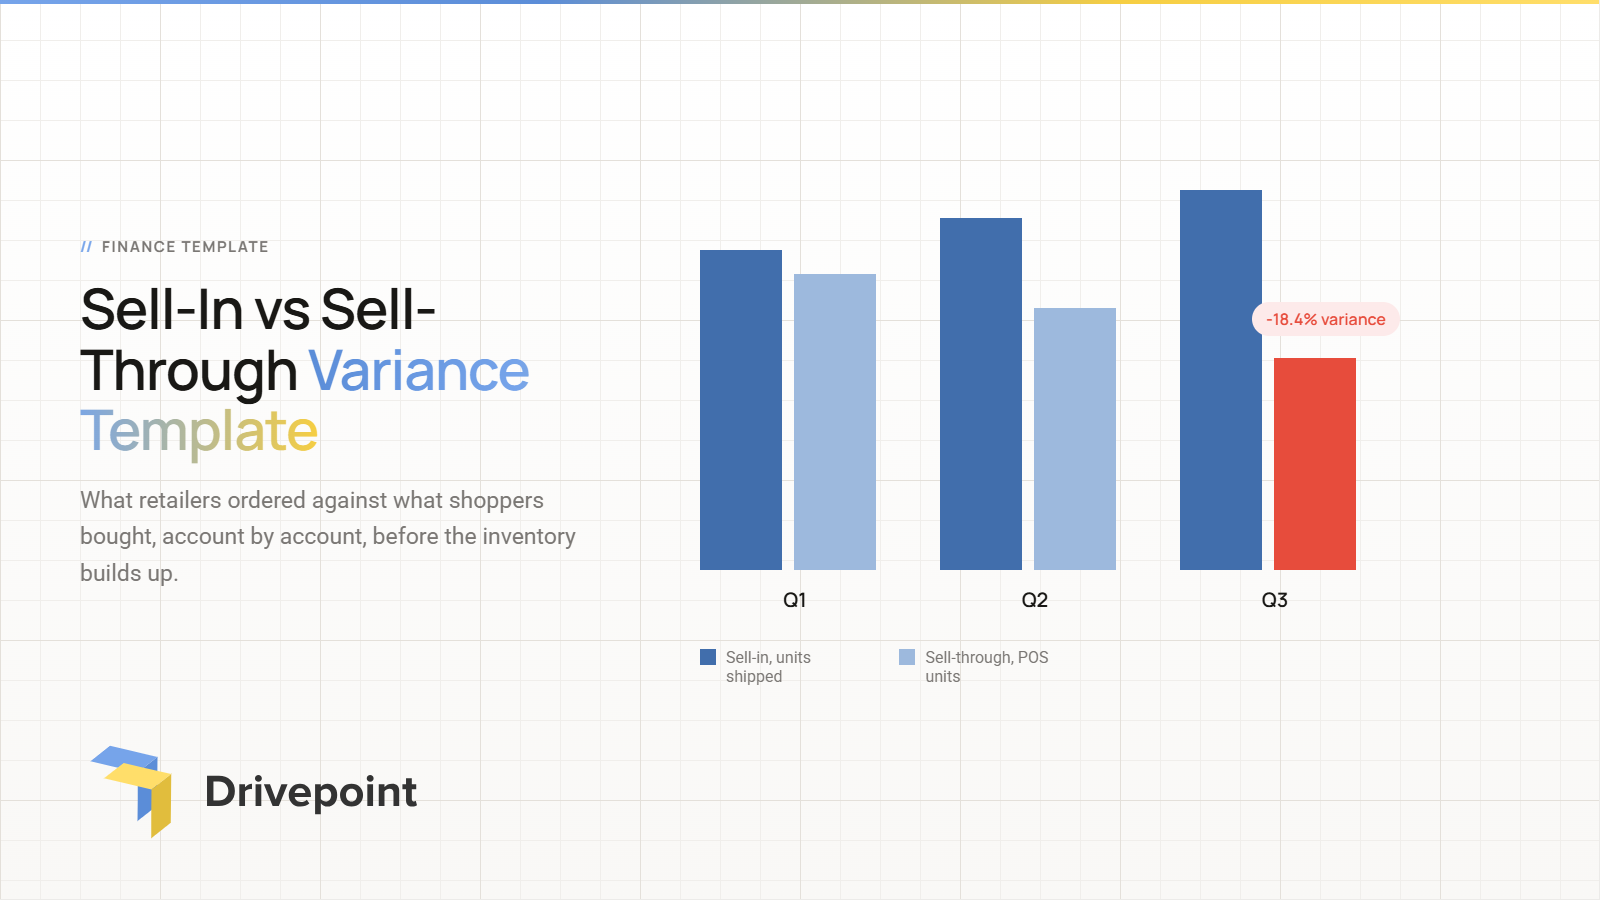
Sell-in less sell-through piles up as inventory in the retailer's warehouse. This template rolls that balance forward every week so you can watch it building.
Download the template that shows you an order cut before it lands, by tracking what you shipped against what consumers actually bought.






Each tab in the template handles one slice of the operating model — drop in your numbers and the rest updates itself.
Sell-in less sell-through piles up as inventory in the retailer's warehouse. This template rolls that balance forward every week so you can watch it building.
The number your buyer is actually looking at when they decide whether to place your next purchase order. Measured on forward consumption, not a trailing average.
Every account gets a status every week. LOADED means the next order gets cut. THIN means the shelf goes empty and your fill rate takes the hit.
One account in the illustrative data finishes at plus 2.5% variance after taking 60,000 units in three weeks then ordering nothing for five. Timing is the finding, not the total.
Take a self-guided tour, or get a walkthrough tailored to your brand.