
Most consumer brands forecast on data that is already weeks old. By the time the books close and the numbers land in a spreadsheet, the forecast describes a business that no longer exists. Financial forecasting software fixes that. It connects to your accounting, sales, and channel data, pulls actuals in automatically, and projects revenue, expenses, and cash forward, so the model updates as the business moves instead of once a quarter. Laundry Sauce runs its business this way and forecasts financial outcomes with 98% accuracy. As CEO Ian Blair put it, if your model is not accurate and you are looking three months out, you are living in fantasy land. Here is what the software does, how it differs from a spreadsheet, what to look for, and why consumer brands need a tool built for their channels.
What is financial forecasting software?
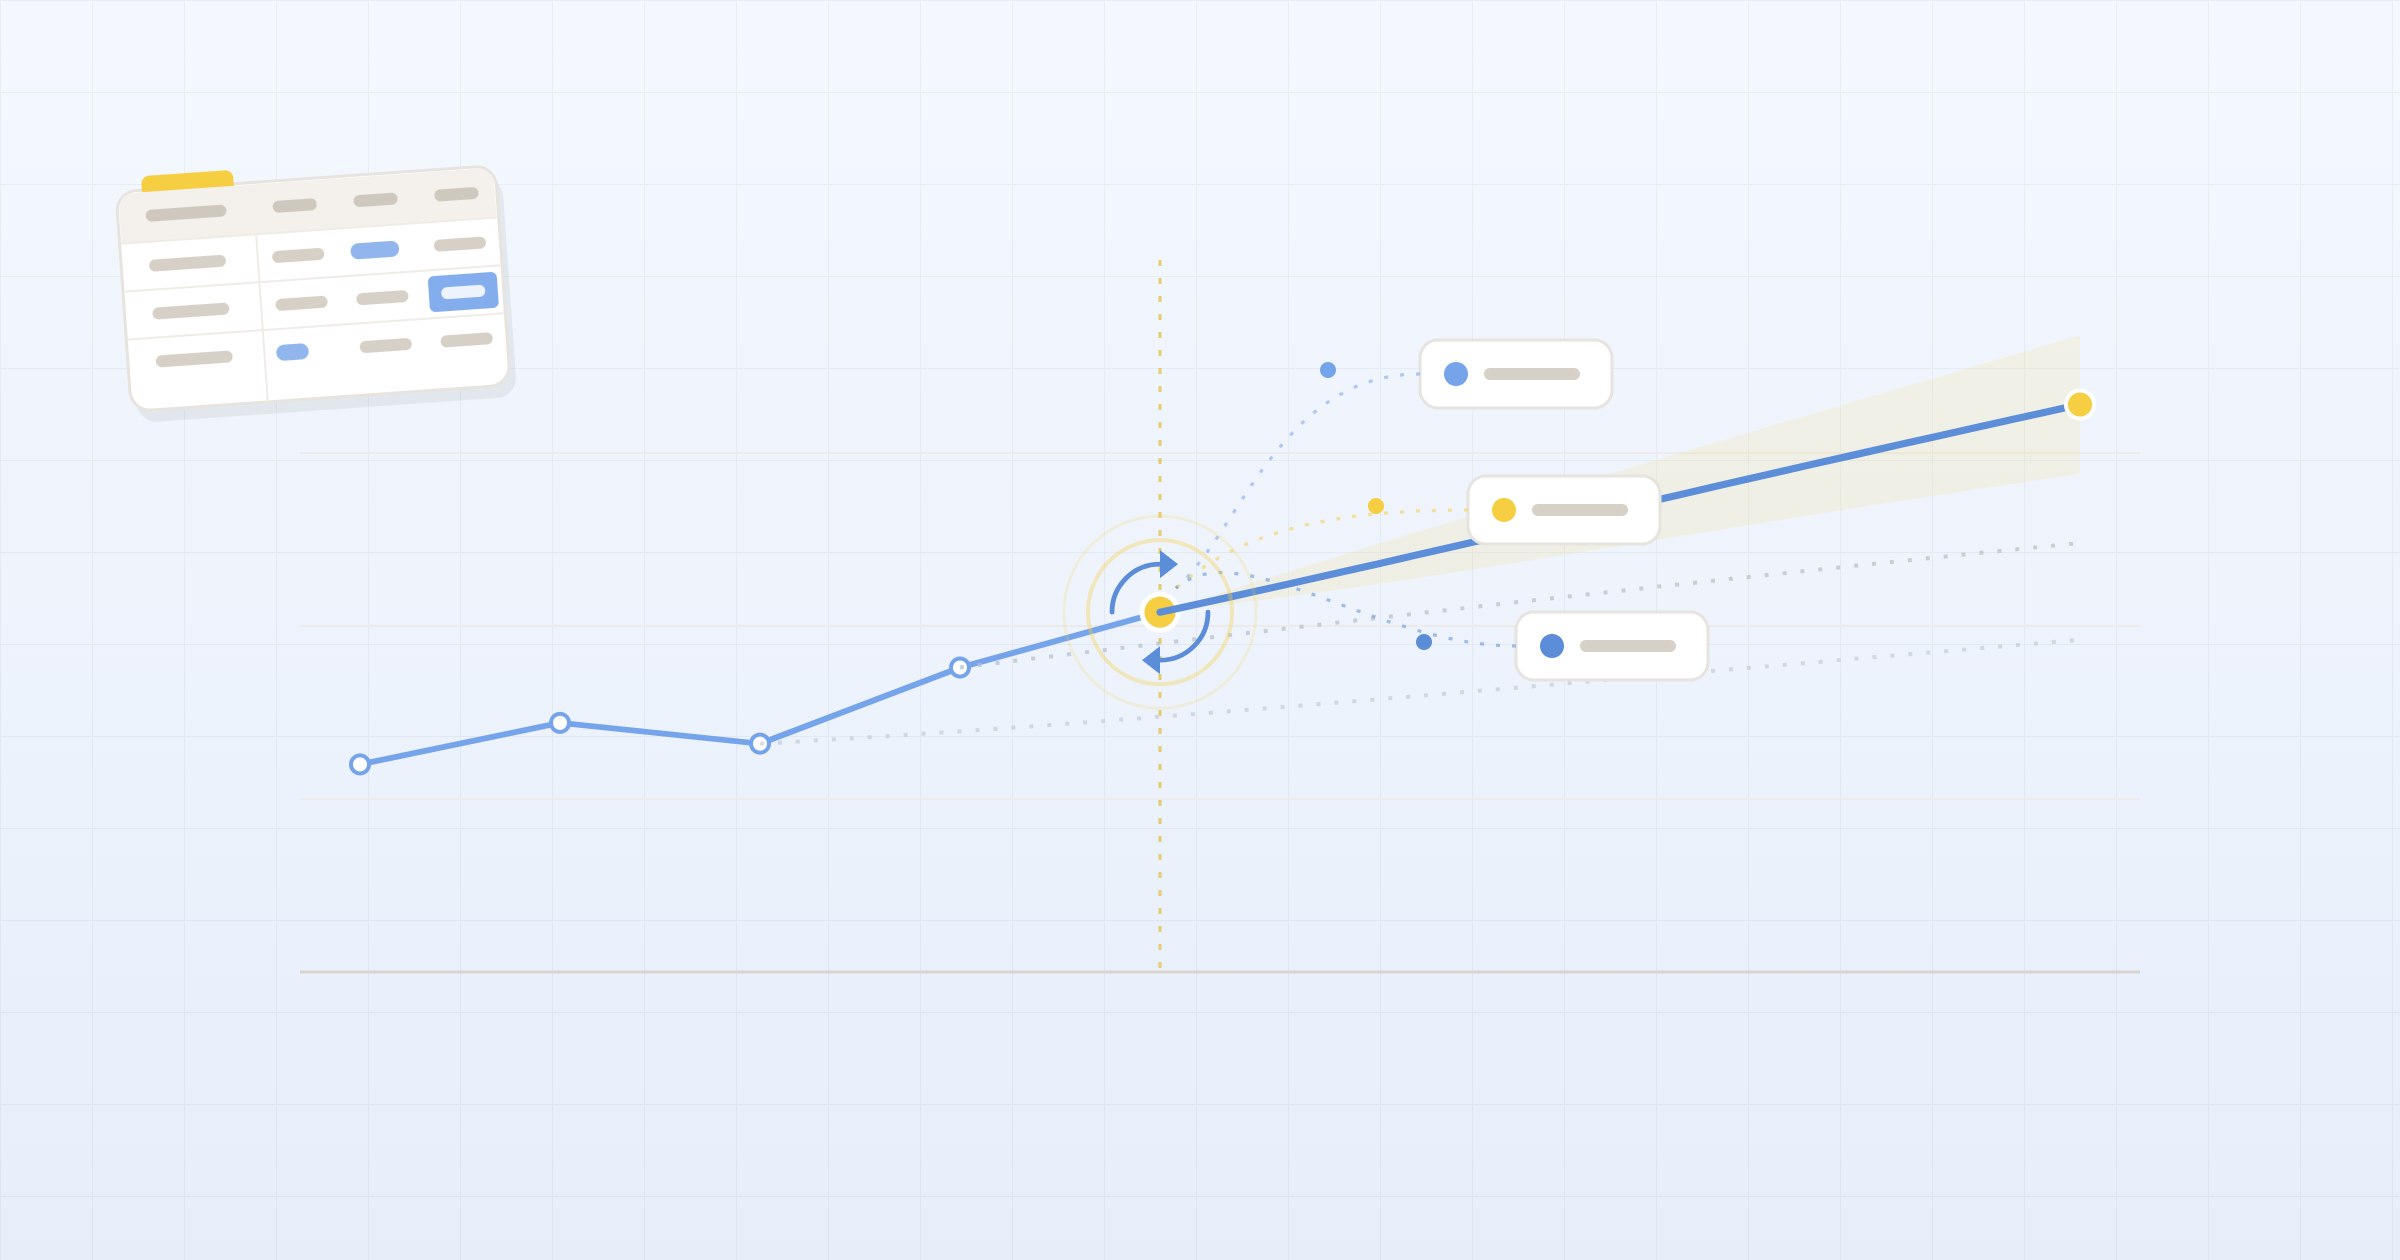
Financial forecasting software is a tool that projects your future revenue, expenses, and cash by pulling in live data and applying your business drivers, instead of relying on a static spreadsheet someone updates by hand. It reads your historical results and current actuals, rolls the forecast forward automatically, and flags where you are off plan and why.
McKinsey found that a rolling forecast, one updated frequently as conditions change rather than set once a year, is the single best predictor of forecasting satisfaction among CFOs.
The difference shows up in speed and accuracy. In the 2025 AFP FP&A Benchmarking Survey, 29% of organizations still needed more than 10 days to produce a forecast, and only 15% could do it in under two. Software closes that gap by removing the manual data work between close and forecast.
Laundry Sauce consolidates Shopify, Amazon, and QuickBooks into one hub and forecasts with 98% accuracy, saving roughly $12,000 a year and 10 hours a month.
Spreadsheets vs. financial forecasting software
Spreadsheets are where most brands start, and they work until they do not. Past a certain scale, the model becomes fragile, single-owner, and always a step behind. As one operator described the old setup, it was Excel and duct tape. The practical differences:
- Data freshness: a spreadsheet relies on manual copy-paste and goes stale, while software pulls actuals automatically.
- Reforecasting: hours or days in a spreadsheet, minutes in software.
- Version control: many files and an unclear source of truth, versus one live model.
- Scenario testing: duplicating the file, versus branching and comparing side by side.
- Error risk: silent and hard to catch, versus driver-level variance flags.
immi felt this directly. Before switching, the team spent 10 to 20 hours a month copying financials across spreadsheets. With forecasting software in place, they cut about 20 hours of manual work a month and lowered actual-versus-budget variance by 50%.
What to look for in financial forecasting software
The features that matter are the ones that keep the forecast current and trustworthy without adding manual work:
- Driver-based modeling: forecast off the metrics that actually move your business, like customer count, AOV, and repeat rate, not a drawn revenue curve.
- Live actuals and automatic roll-forward: actuals show up on their own and the model reforecasts itself.
- Side-by-side scenarios: branch, compare, and stress-test without duplicating files.
- Multi-channel and accounting integrations: Shopify, Amazon, retail, NetSuite, QuickBooks, and more feeding one model.
- Version control and permissions: one source of truth the whole team can see.
- AI variance explanation: not just what changed, but why.
SEEQ used this to go from quarterly forecasts to continuous, real-time planning, spinning up scenarios in a few clicks to redesign their entire Shopify strategy around subscription take rates, AOV, and CAC.
Which financial forecasting software fits your stage?
The right tool depends on your size and how your business runs:
- Early / SMB: simple revenue and cash forecasting that is fast to set up.
- Mid-market / scaling: driver-based, three-statement modeling with real scenario planning.
- Enterprise: large dataset consolidation and cross-team collaboration.
- Spreadsheet-first teams: software that connects directly to Excel or Google Sheets.
For consumer brands, the deciding factor is rarely the modeling engine. It is whether the tool integrates with your actual stack, your ecommerce platforms, retailers, and accounting, so you are not stuck doing manual data work every cycle.
Why consumer brands need software built for their channels
General FP&A tools were built for SaaS and services. Consumer brands run on SKUs, cohorts, inventory, and channel economics that horizontal tools do not model well. Forecasting a DTC business is not the same as forecasting wholesale, where lead times and purchase orders drive everything, or retail, where a launch ties up cash months before revenue arrives.
That is also where the integration question decides everything. A forecast is only as current as the data behind it, and consumer brands pull from more systems than most: Shopify, Amazon, TikTok Shop, retail portals, a 3PL, and the GL. Software built for consumer brands connects those directly and keeps one live model, instead of leaving you to reconcile exports by hand.
Drivepoint keeps the model in Excel and makes it smarter, so your team keeps its formulas and muscle memory while actuals, roll-forward, and variance happen automatically. immi runs cohort-level forecasting across DTC and Amazon on this setup, and it powered their move into wholesale.
Getting started without a six-month implementation
If you have been burned by a patchwork of tools before, the reasonable worry is a long, painful rollout. It does not have to be. A model connected to your data can be producing forecasts in days, and from there the payoff compounds: reforecast in minutes, see daily pacing against plan, and walk into board meetings without weeks of prep. That is the real shift. Finance stops being the function that reports what already happened and starts being the one that tells you what to do next.
Financial forecasting software: common questions
What is financial forecasting software and how does it work?
It is a tool that projects future revenue, expenses, and cash by connecting to your accounting and sales data, applying your business drivers, and rolling the forecast forward automatically as actuals come in. Instead of updating a spreadsheet by hand, you get a model that stays current on its own and flags where you are off plan.
How is financial forecasting software different from forecasting in Excel?
Excel forecasts are manual and go stale fast, with one owner copying data between files and no clear source of truth. Forecasting software keeps one live model connected to your data, reforecasts in minutes instead of days, and flags variance automatically. The best options keep you in Excel and add the live data and automation on top.
What features should financial forecasting software have for a consumer brand?
Driver-based modeling, live actuals with automatic roll-forward, side-by-side scenario planning, version control, and integrations with your ecommerce platforms, retailers, and accounting system. For consumer brands specifically, look for SKU-level and cohort forecasting and the ability to model DTC, wholesale, and retail economics in one place.
How accurate can financial forecasting be with the right software?
Accuracy depends on your data and drivers, but brands using connected, driver-based models routinely hit the 90s. Laundry Sauce forecasts with 98% accuracy, and immi cut its actual-versus-budget variance by 50% after moving off manual spreadsheets.
How long does it take to implement financial forecasting software?
A model connected to your data can produce forecasts in days, not months, especially when the platform handles the integrations and setup for you. The ongoing win is bigger than the setup: reforecasting drops to minutes and board prep stops being a multi-week project.