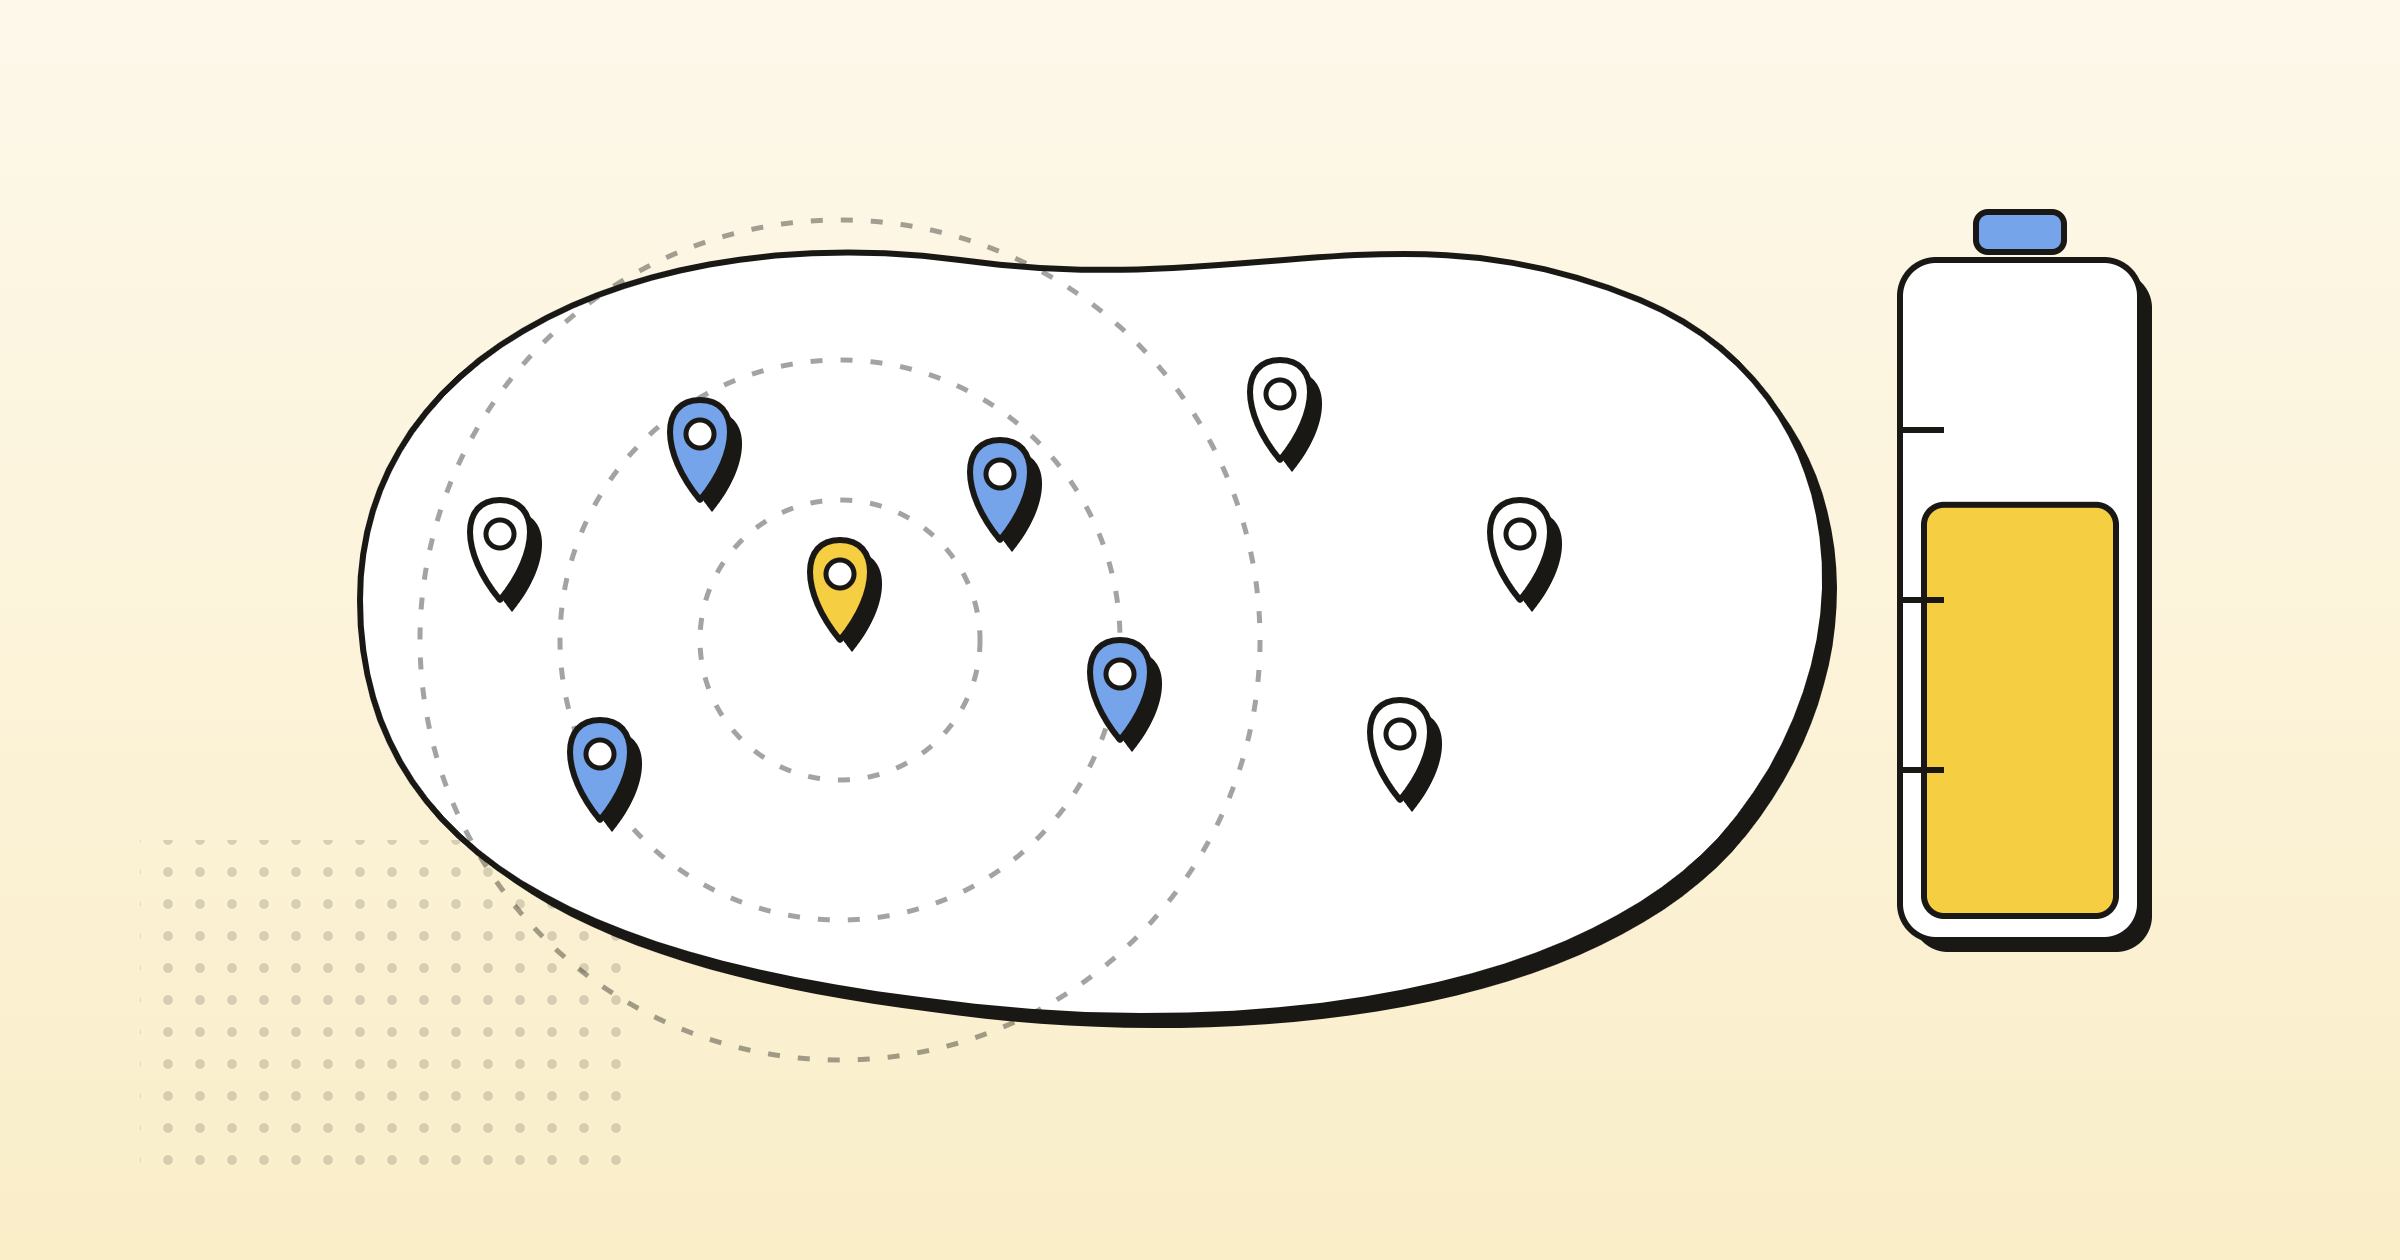
Cohort analysis groups your customers by a shared starting point, usually the month of their first order, and tracks how each group behaves over time. Instead of one blended retention number, you see whether the customers you acquired in March actually come back, spend more, and pay back what you spent to get them.
That visibility is worth real money. The average DTC brand sees only 28.2% of first-time buyers return for a second purchase, and ecommerce acquisition costs climbed 40 to 60% between 2023 and 2025. When VKTRY ran cohort analysis on its transaction data, it found that most repeat buyers made their second purchase within 30 days of the first. The team moved its email flows and direct mail earlier and lifted 30-day retention by 10%.
This guide covers what cohort analysis is, the cohort types that matter for consumer brands, how to run one step by step, and how to turn retention curves into LTV, CAC, and payback decisions you can defend to a board.
What Is Cohort Analysis? (And Why Averages Lie to You)
A cohort is a group of customers who started at the same time: everyone whose first order landed in January, everyone acquired during the Black Friday push, everyone whose first purchase came through Amazon. Cohort analysis follows each group forward, month by month, and measures how many come back, what they spend, and what they cost to serve.
This is not segmentation. Segmentation groups customers by who they are: geography, product preference, order size. Cohort analysis groups customers by when they started, then watches behavior unfold. Segmentation gives you a snapshot. Cohorts give you a movie.
The movie matters because averages lie. Say your blended repeat purchase rate has held at 32% all year. Comfortable number. But cut it by cohort and you might find customers acquired in 2024 repeating at 41% while buyers from the last six months repeat at 23%. The average looks stable because your loyal early base is padding it. Customer quality is eroding underneath, and no topline dashboard will show you. This is where finance leaders at consumer brands tell us the anxiety lives: CAC and LTV blind spots, and the nagging sense that we don't know what we don't know.
The Cohort Types That Matter for a Consumer Brand
Most analytics guides start with demographic cohorts. Skip them. Age and zip code rarely explain a reorder decision. Start with the cuts that map to money:
- Acquisition cohorts: customers grouped by first-order month. This is the foundation. It tells you whether the customers you are buying today are better or worse than the ones you bought last year.
- Channel cohorts: Shopify vs. Amazon vs. TikTok Shop vs. retail. Different channels recruit very different customers, and channel-level retention is what reveals which CAC is actually sustainable.
- Product and SKU cohorts: customers grouped by first product purchased. Some SKUs recruit one-and-done buyers. Others reliably start a habit. Knowing which first order predicts a repeat is one of the highest-value answers in your data.
- Subscription vs. one-time cohorts: subscribers follow retention curves, one-time buyers follow repurchase curves. Blend them and you corrupt both.
Earth Breeze is a useful example of why this matters. The brand sells through its Shopify site, Amazon, Walmart, and brick-and-mortar retail, with both one-time and subscription options. The team knew intuitively that each customer type carried a different lifetime value, but could not quantify the difference. Building custom segments and modeling historical and predicted retention for each cohort produced an accurate LTV per segment, and with it the confidence to set hard CAC guardrails while scaling revenue with positive margins.
Notice what Earth Breeze built: cohorted financials, not a cohorted marketing dashboard. Retention percentages are interesting. Retention connected to contribution margin and cash is decision-grade. That distinction drives everything below.
How to Run a Cohort Analysis, Step by Step
- Define the cohort. Start with first-order month, split by channel. Every customer belongs to exactly one cohort, assigned by their first purchase and never reassigned.
- Pick the metric. Repeat purchase rate is the entry point. Net revenue LTV and contribution margin per cohort are where the decisions live. Track at least one revenue metric and one margin metric per cohort.
- Set the timeframe. Measure in 30, 60, and 90-day intervals from each customer's first order. One nuance operators raise constantly: a 30-day basis and a calendar-month basis produce different numbers. A customer who buys January 28 and again February 3 repeated in 6 days, not one month. Pick one convention and hold it.
- Build the retention curve from actual transaction data. Rows are cohorts, columns are periods since first order. Read across a row to see decay. Read down a column to compare cohorts at the same age. That column view is where quality trends show up first.
- Act on the drop-off points. The curve tells you when customers leave. Your retention program should hit before that moment, not after.
VKTRY's retention prediction model shows what step five looks like in practice. The analysis revealed that most second purchases happened within 30 days of the first, so waiting until day 45 to trigger winback email was waiting too long. The team moved email flows and direct mail earlier and increased 30-day retention 10%, with the model predicting 30-day retention at 95% accuracy.
A note on tooling. You can build all of this in a spreadsheet, and plenty of brands start there. The approach breaks on refresh day. Every export goes stale the moment you pull it, and as one operator put it, every time I refresh this, I have to go in and update the numbers. The durable fix is cohort math that actualizes automatically from a single source of truth for your data across Shopify, Amazon, and retail, so the curves roll forward with your actuals instead of waiting on a manual rebuild.
From Cohort Curves to LTV, CAC, and Payback
Retention curves are the input. The outputs that change decisions are lifetime value, LTV to CAC, and payback period, calculated per cohort and per channel.
The math is unforgiving right now. Acquisition costs rose 40 to 60% from 2023 to 2025, and Harvard Business Review's long-standing estimate puts the cost of acquiring a new customer at 5 to 25 times the cost of retaining an existing one. McKinsey's work on customer lifetime value reaches the same conclusion from the other direction: companies that cluster cohorts by CLV and CAC make measurably better marketing and operational decisions than companies managing to averages.
Two rules keep cohort-level LTV honest. First, use the full cost stack. A cohort can look strong on top-line revenue and lose money once returns, fulfillment, and landed margin are in the calculation. Net revenue LTV against fully loaded CAC is the number a board will trust. Second, translate LTV into CAC tolerance: the answer to the question every retention-driven founder eventually asks, which is how much can I safely spend before I am out of money.
Dose, a subscription wellness brand, is the proof case. Predictive retention modeling gave the team clarity on payback and CAC tolerance, and the confidence to scale spend against it. The results: $120K saved annually versus hiring in-house finance, 240 hours a year back, and a 3 to 4% gross margin improvement from negotiating with suppliers on the strength of accurate volume forecasts.
Payback by cohort also changes your working capital math. If a channel pays back in 45 days, you can finance inventory and ad spend against it aggressively. If it pays back in 9 months, that spend is a use of cash you need to plan for. This is where cohort analysis stops being a marketing exercise and becomes an input to DTC revenue forecasting and cash planning.
Five Cohort Analysis Mistakes That Cost Consumer Brands Money
- Reading averages instead of curves. Your newest, weakest cohorts hide inside blended numbers for quarters before they surface in the P&L. By then the spend is gone.
- Measuring on calendar months when your reorder cycle runs on 30-day intervals. The mismatch systematically overstates or understates retention depending on where orders land in the month.
- Stopping at revenue. A cohort that repeats often but buys discounted, high-return, heavy-to-ship products can be your least profitable. Run the curves on contribution margin, not just top-line.
- Confusing correlation with causation. When one cohort outperforms, find out what actually drove it before scaling the supposed cause. A strong March cohort might be your new bundle, or it might be a competitor's stockout.
- Letting the data go stale. A cohort model in a static spreadsheet is out of date the day after you build it. If the analysis cannot roll forward with your actuals, it will get built once, presented once, and abandoned.
The payoff for getting this right goes beyond marketing efficiency. Real cohort curves, tied to real margins, give you a retention story your board actually believes, backed by board-ready retention reporting instead of hand-waving about loyal customers. That is the difference between defending your numbers and hoping nobody asks.
This is exactly what Drivepoint for Marketing gives marketing teams: retention and CAC by cohort next to the P&L finance already trusts.
Drivepoint has the cohort math built in: retention curves, new vs. returning splits, and channel-level LTV and CAC calculated automatically from your actual transaction data, inside the Excel model you already own. See how cohort and LTV analysis works in Drivepoint, or book a demo to run the curves on your own data.
Cohort Analysis FAQs
What is the cohort analysis method?
Cohort analysis groups customers by a shared starting point, usually the month of their first order, then tracks each group's behavior over time: repeat purchases, revenue, and margin. Because every group is measured from its own start date, you can compare customer quality across acquisition periods instead of relying on one blended average.
What is the difference between segmentation and cohort analysis?
Segmentation groups customers by who they are: geography, product preference, order size. Cohort analysis groups customers by when they started, then follows their behavior forward month by month. Segmentation gives you a snapshot; cohorts show you a trend. Most consumer brands need both, but only cohorts reveal whether customer quality is improving or eroding as you scale spend.
How do you read a cohort analysis chart?
In a standard cohort table, each row is a cohort (customers acquired in a given month) and each column is a period since first order (month 1, month 2, month 3). Reading across a row shows how one cohort decays over time. Reading down a column compares cohorts at the same age, which is where you spot improving or deteriorating customer quality. A healthy chart shows newer rows retaining as well as or better than older rows at the same age.
Can you do cohort analysis in Excel?
Yes. Excel handles the math well: a transaction export, a first-order-date lookup, and a pivot table will produce a cohort grid. The limits are operational, not analytical. Manual exports go stale, formulas break as data grows, and every refresh means re-pulling and re-mapping data. Drivepoint is Excel-native, so the cohort math lives in the spreadsheet you already trust and actualizes automatically from live Shopify, Amazon, and retail data.
What is a good repeat purchase rate for a consumer brand?
As of 2026, the average DTC brand sees about 28.2% of first-time buyers return for a second purchase, so anything above 30% puts you ahead of the pack. The right benchmark varies by category and price point: consumables and supplements should run meaningfully higher than durable goods. The more useful question is whether your newest cohorts repeat at a higher rate than the ones before them.