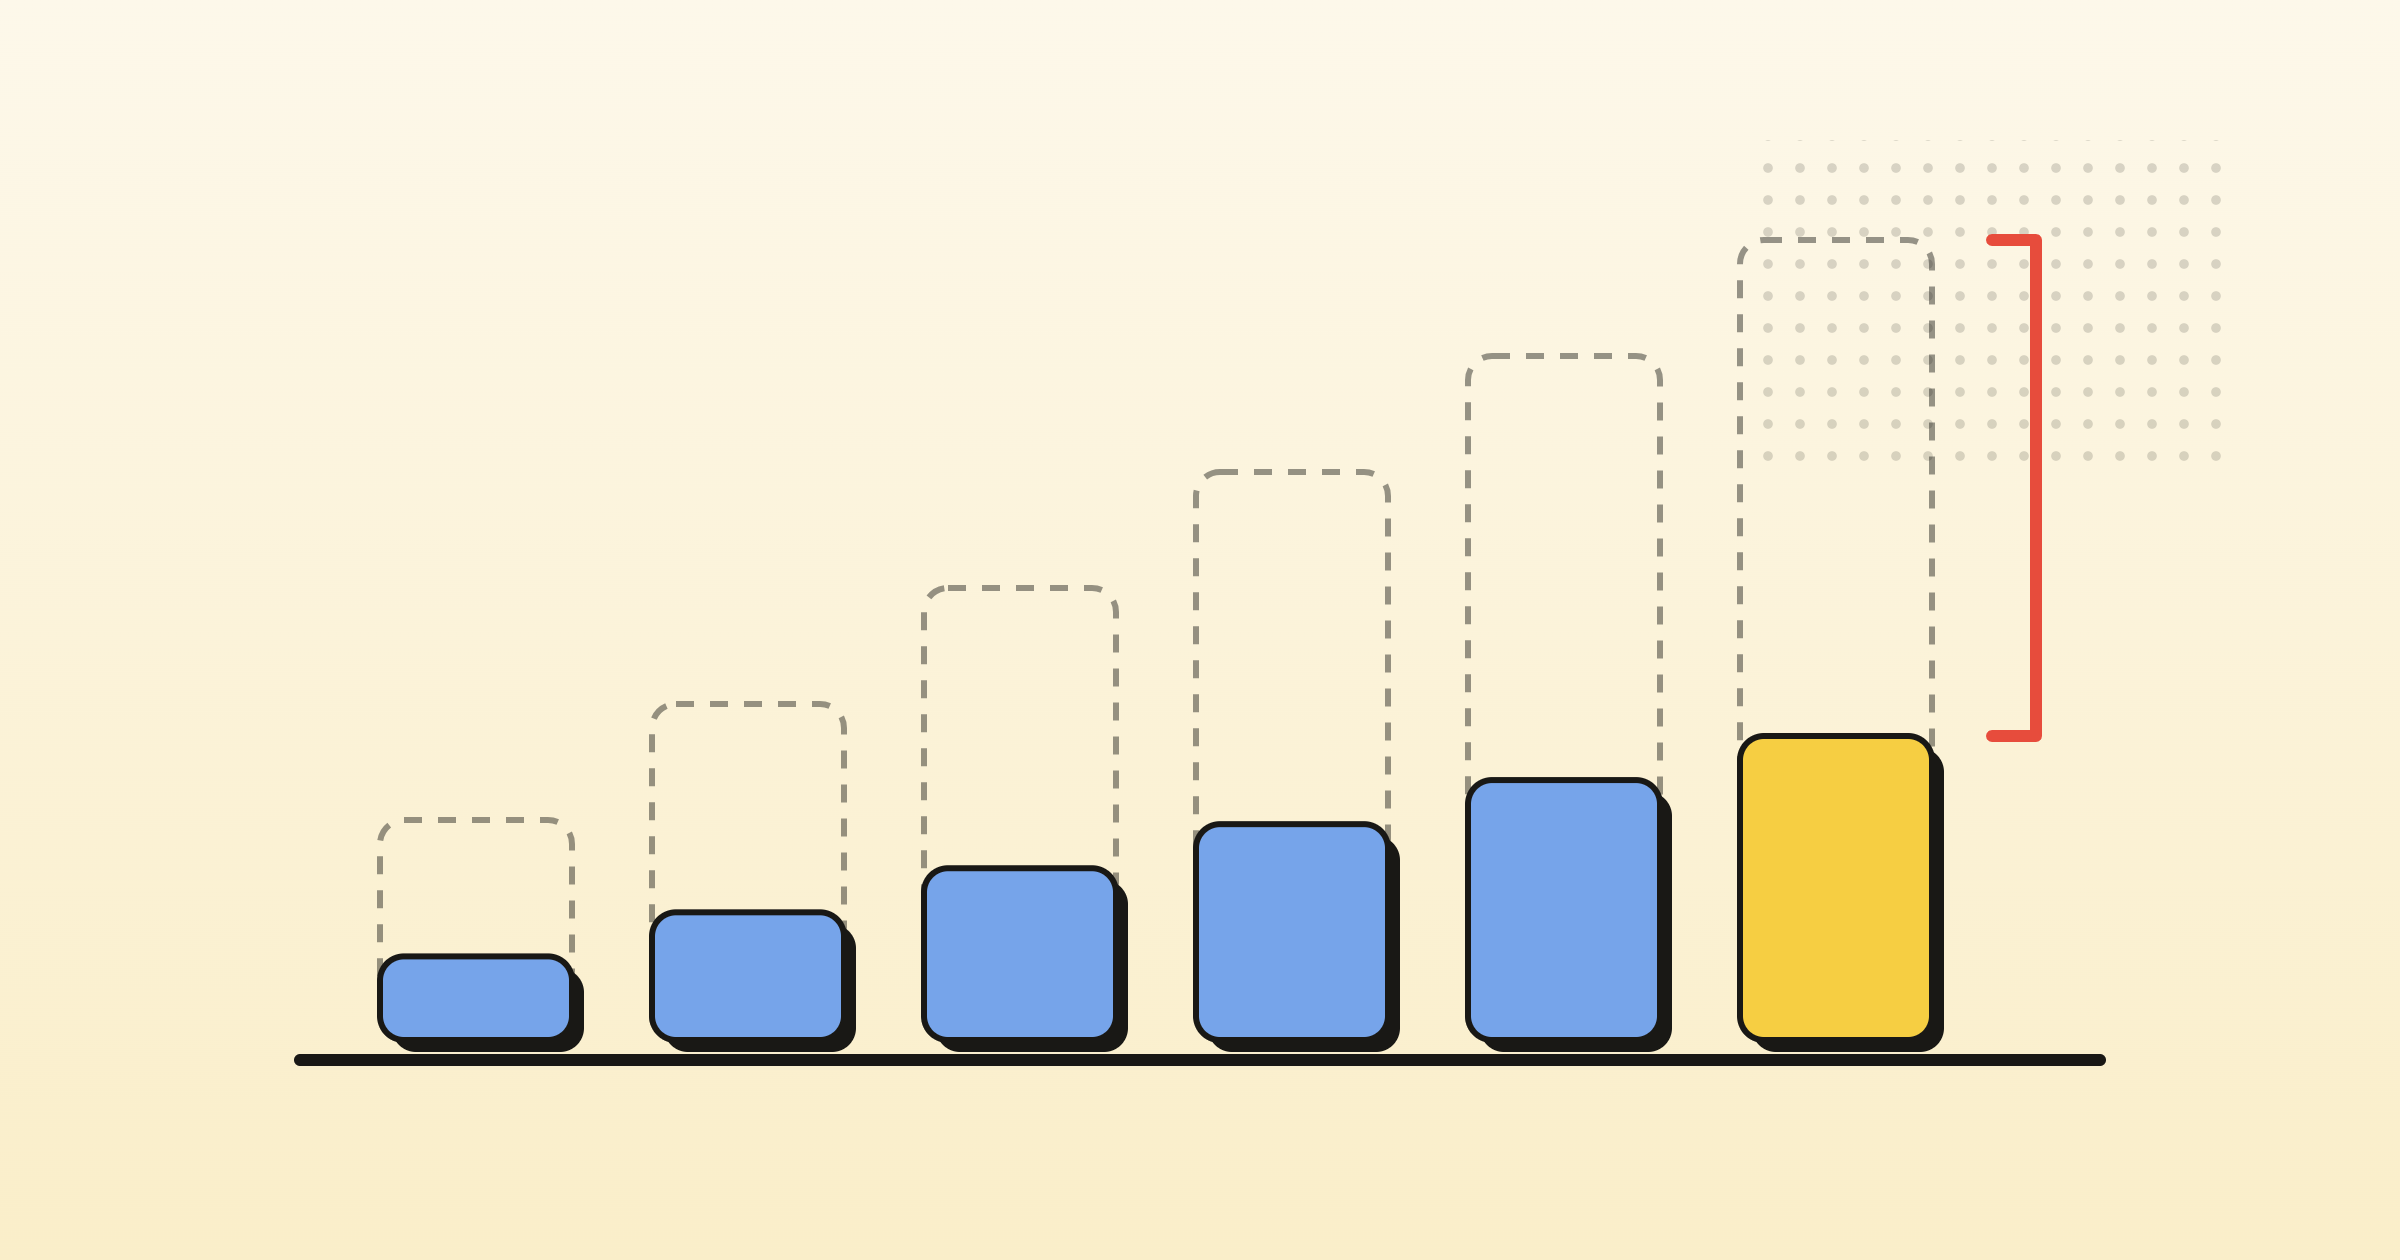

Mad Rabbit's cohort reports showed something the team did not want to see. Twenty percent of their DTC customers bought a single discounted product and never came back. After acquisition cost and every direct variable cost, the company lost money on all of them. The fix was counterintuitive: stop selling to those people. EBITDA rose roughly 20% in the months that followed.
No product analytics tool would have surfaced that.
Cohort analysis software groups customers by when they were acquired and tracks what that group does next. Most of it tracks behavior and revenue: did they come back, what did they spend. Very little of it tracks profit, which means it can tell you a cohort returned without telling you whether the cohort was worth acquiring in the first place.
Here are the five categories of cohort analysis software, what each is genuinely good at, and the question each one cannot answer.
Behavioral cohorts and financial cohorts are not the same thing
Behavioral cohort analysis answers one question: did this group come back. Financial cohort analysis answers a different one: did this group pay for itself. Both are cohort analysis. They need different data, and usually different software.
It helps to think in three layers:
- Retention. Did the cohort return, and how fast did it decay. This is where most tools live.
- Revenue. What did the cohort spend over its lifetime. Many tools handle this now, including refunds and chargebacks.
- Contribution profit. What was left after acquisition cost, cost of goods, shipping, platform fees and returns. This is where almost every tool stops.
The gap matters because the first two layers can look healthy while the third is negative. A cohort with strong repeat rates and a discount-driven first order can retain beautifully and still lose money on every transaction. One finance lead described his customer profitability number as "a slippery number." That is usually what he means.
McKinsey makes a related point in its work on customer lifetime value: cohorts are most useful when lifetime value and acquisition cost are read together, not separately.
The 5 categories of cohort analysis software
1. Product analytics
Mixpanel, Amplitude, Heap.
Best for: feature adoption, in-app behavior, activation and churn signals. These are strong products with deep querying, and modern versions handle revenue cohorts, including post-purchase adjustments like refunds and cancellations when connected to a warehouse.
What they were not built for: cost of goods, landed cost, freight, platform fees and acquisition cost allocation. They are product data platforms, not financial systems. Revenue by cohort, yes. Contribution profit by cohort, no.
2. Web and marketing analytics
Google Analytics 4.
Best for: acquisition-channel and campaign retention views, at no cost.
What it was not built for: reconciling blended and paid acquisition cost, or carrying your margin structure. GA4 will tell you which channel produced a cohort. It will not tell you what that cohort was worth after you paid to make and ship the product.
3. Ecommerce and retention platforms
Best for: repeat purchase rate, subscription churn and lifecycle triggers on DTC.
What they were not built for: consolidating DTC with Amazon, wholesale and retail into one customer view. If a meaningful share of your revenue moves through a retailer, these tools see a fraction of the picture.
4. BI and SQL
Looker, or a warehouse with dbt models on top.
Best for: total flexibility. If you have an analyst, you can build any cohort definition you want.
What it costs you: the analyst. Cohort logic lives in queries rather than in a shared model, so definitions drift between dashboards and nobody can say which version is right. As one operator put it, everybody ends up waiting on the analytics person.
5. FP&A-native cohort analysis
This is where Drivepoint sits.
Best for: cohorted profit and loss, running from sales down to contribution profit by acquisition cohort, tied to the same financial model that produces your forecast.
The tradeoff: it requires your cost data, your general ledger and your channel data in one place. That setup work is real. It is also the only way to answer the profit question.
For Mad Rabbit, that combination is what exposed the unprofitable segment. Cohorted financial analysis ran lifetime value from sales through contribution profit by acquisition cohort. Layering acquisition cost on top made the answer unambiguous.
The one question to ask any cohort tool
Can this tell me whether a cohort is profitable after acquisition cost, cost of goods, shipping, returns and platform fees?
If the answer is no, it is a behavior tool. That is a legitimate thing to be. Just do not plan acquisition spend with it.
Here is how the three layers compare:
| Layer | What it shows | Data required | Decision it supports |
|---|---|---|---|
| Retention cohorts | Whether and when customers return | Order or event history | Lifecycle timing, email and retention programs |
| Revenue cohorts | Cumulative spend per cohort | Order history plus refunds | Channel and campaign comparison |
| Contribution profit cohorts | What is left after all variable costs | Orders, COGS, freight, fees, returns, CAC | Acquisition spend, discount strategy, channel mix |
A few traps are specific to consumer brands and worth naming:
- Returns land late. A refund that arrives 45 days after the order often lands after the cohort window closes, which flatters early cohorts.
- Blended and paid CAC are different numbers. Mixing them is the most common error in cohort work. Blended divides all marketing spend by all new customers. Paid divides paid spend by paid customers. Use both, deliberately.
- Retail and marketplace cohorts are invisible without portal data. Amazon in particular tends to be described as a black box until the reporting is rebuilt around it.
- Subscription and one-time behave nothing alike. Averaging them together produces a curve that describes neither.
Dose runs into most of these at once as a subscription-driven wellness brand. Their predictive retention work changed the question from which cohort looks stronger to something more useful: improve this metric by a given percentage, or optimize acquisition cost by another, and here is which one moves faster. The brand saved $120,000 annually and lifted gross margin 3 to 4 points.
Can you do cohort analysis in Excel?
Yes. Plenty of good finance teams do, and it is often the right place to start. Acquisition month as rows, months since acquisition as columns, SUMIFS to fill the grid.
The spreadsheet version breaks in four predictable places:
- CAC allocation. Splitting spend across channels and back to cohorts by hand is where the errors start.
- Refunds and returns. They arrive after the fact and require restating cohorts you already reported.
- The monthly roll forward. Every close means re-pointing formulas, and the file grows until it takes a long time to even open.
- Ownership. One person ends up the only one who can safely touch it.
None of that is an argument for abandoning Excel. It is an argument for the spreadsheet to stop being the source of truth while staying the place you work. That distinction is the whole point: keep the interface, move the data underneath it.
VKTRY hit this wall after sales tripled in a year. The team had twenty spreadsheets open at once, trying to make Shopify and Amazon match. Once the data was consolidated, the retention model surfaced something actionable: most customers make their second purchase within 30 days of the first. That single finding changed when email and direct mail went out, and produced a 10% increase in 30-day retention at 95% prediction accuracy.
The SQL route works too, if you have an analyst. The caution is the same one from category four: when cohort definitions live in queries rather than in the model, two dashboards eventually disagree and nobody can adjudicate.
What changes when cohorts are tied to the P&L
Customer profitability measures what already happened. Lifetime value is a forecast. Most cohort tooling is built for the first and gets used as though it were the second.
When the cohort view and the financial model are the same model, that changes. You stop asking what a cohort was worth and start asking what the next one will be worth at a given acquisition cost, discount level and product mix. Cohort analysis moves out of reporting and into planning, which is where it actually earns its keep.
That is what gave Mad Rabbit the confidence to stop pursuing a fifth of its DTC customers, a decision that reads as reckless until the numbers are in front of you. "Drivepoint gives me very strong conviction in the decisions I need to make because the numbers are clear as day," says Oliver Zak, Co-Founder and CEO. "And that makes the decisions easier."
Most cohort analysis software will tell you who came back. Fewer tools will tell you who was worth having.
See what cohorted profit and loss looks like for your brand.
For marketing teams, that same cohort view lives inside Drivepoint for Marketing: CAC, retention, and LTV tied to the same numbers finance reports.
Cohort analysis software: common questions
What is cohort analysis software?
Cohort analysis software groups customers by when they were acquired, then tracks what that group does over time. Most tools measure behavior and revenue. Fewer measure profit, which requires cost of goods, fees, freight and returns alongside the customer data.
How do I perform cohort analysis in Excel?
Build a table with acquisition month as rows and months since acquisition as columns, then use SUMIFS to fill each cell with orders or revenue from that cohort. It works well. It breaks when you add CAC allocation, refunds and the monthly roll forward.
What is the difference between behavioral and financial cohort analysis?
Behavioral cohort analysis answers whether a group came back. Financial cohort analysis answers whether that group paid for itself after acquisition cost, cost of goods, shipping, fees and returns. A cohort can retain well and still lose money on every order.
Do I need cohort analysis software if I already have Google Analytics?
It depends on the question. GA4 handles acquisition-channel retention well. It does not carry your cost of goods, landed cost or platform fees, so it cannot tell you whether a cohort was profitable. For spend decisions, you need cost data in the same view.
What is the difference between blended CAC and paid CAC?
Blended CAC divides total marketing spend by all new customers, including organic. Paid CAC divides paid spend by customers attributed to paid. Blended looks better and hides channel problems. Cohort work needs both, because mixing them quietly breaks payback math.